

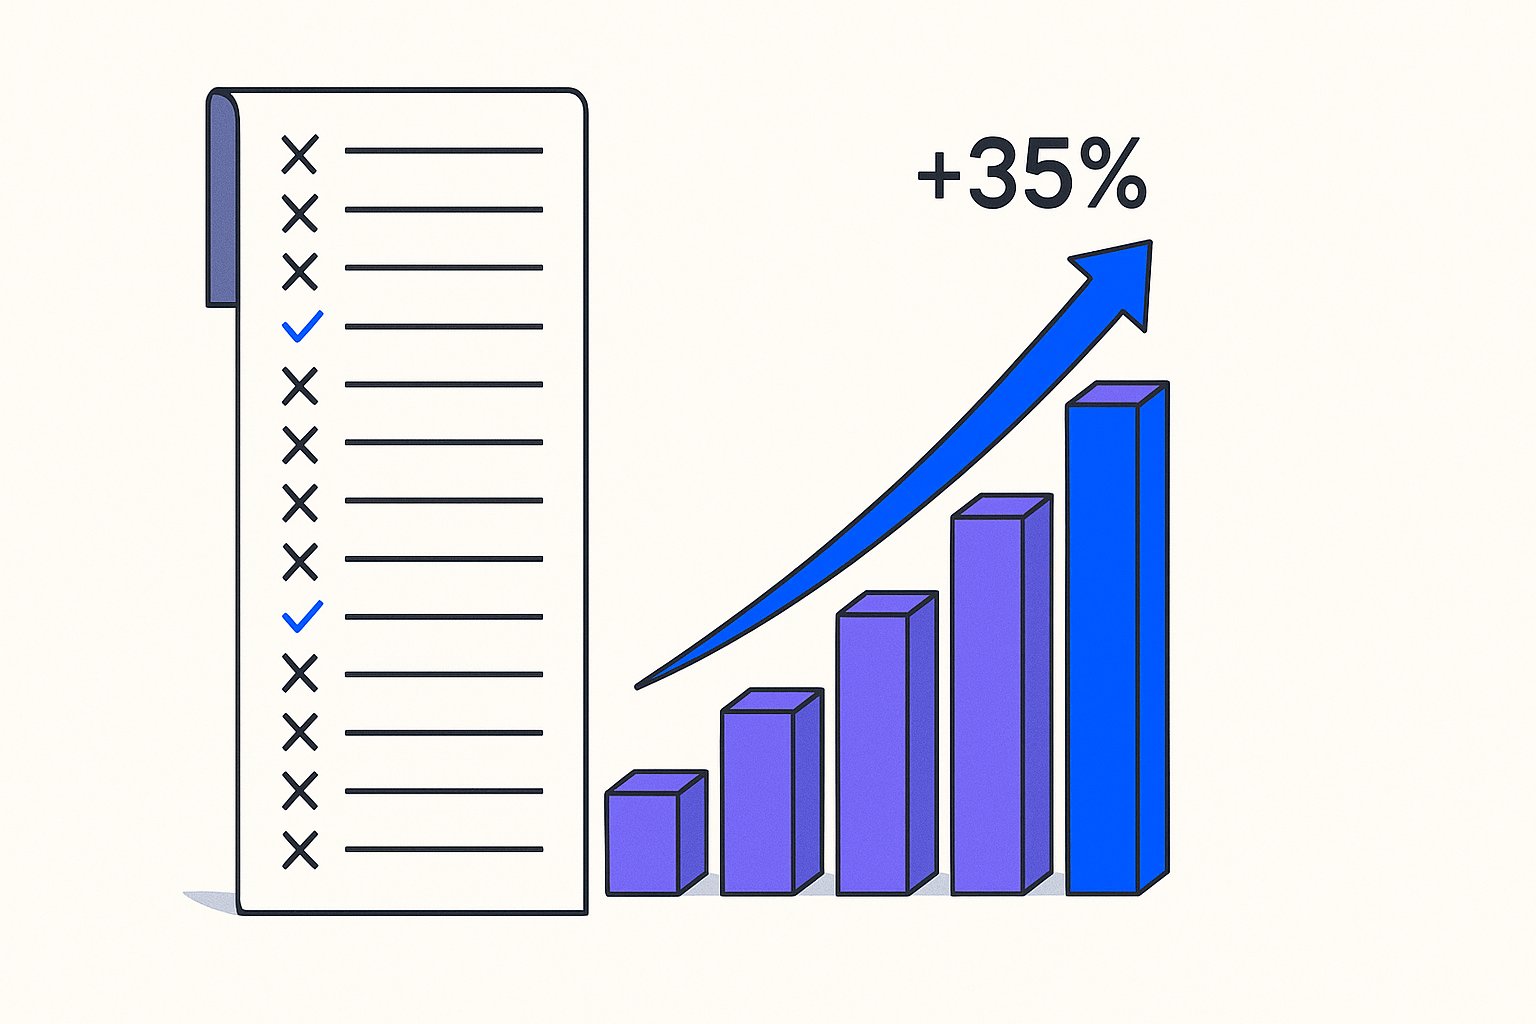
After auditing 60+ Shopify and WooCommerce stores in the first half of 2025, we found that the average product feed contains at least 9 fixable data problems — and that fixing even 3 of the high-impact ones moves ROAS by 18–35% within two weeks. This checklist organises those 23 data points into a single session you can run today, whether you're doing a free product feed audit manually or using a tool to accelerate it.
If you want an automated pass through all 23 of these points before investing time in manual fixes, a structured shopping feed audit can surface the highest-impact issues in minutes.
Why Most "Feed Audits" Miss the Problems That Actually Cost You Money
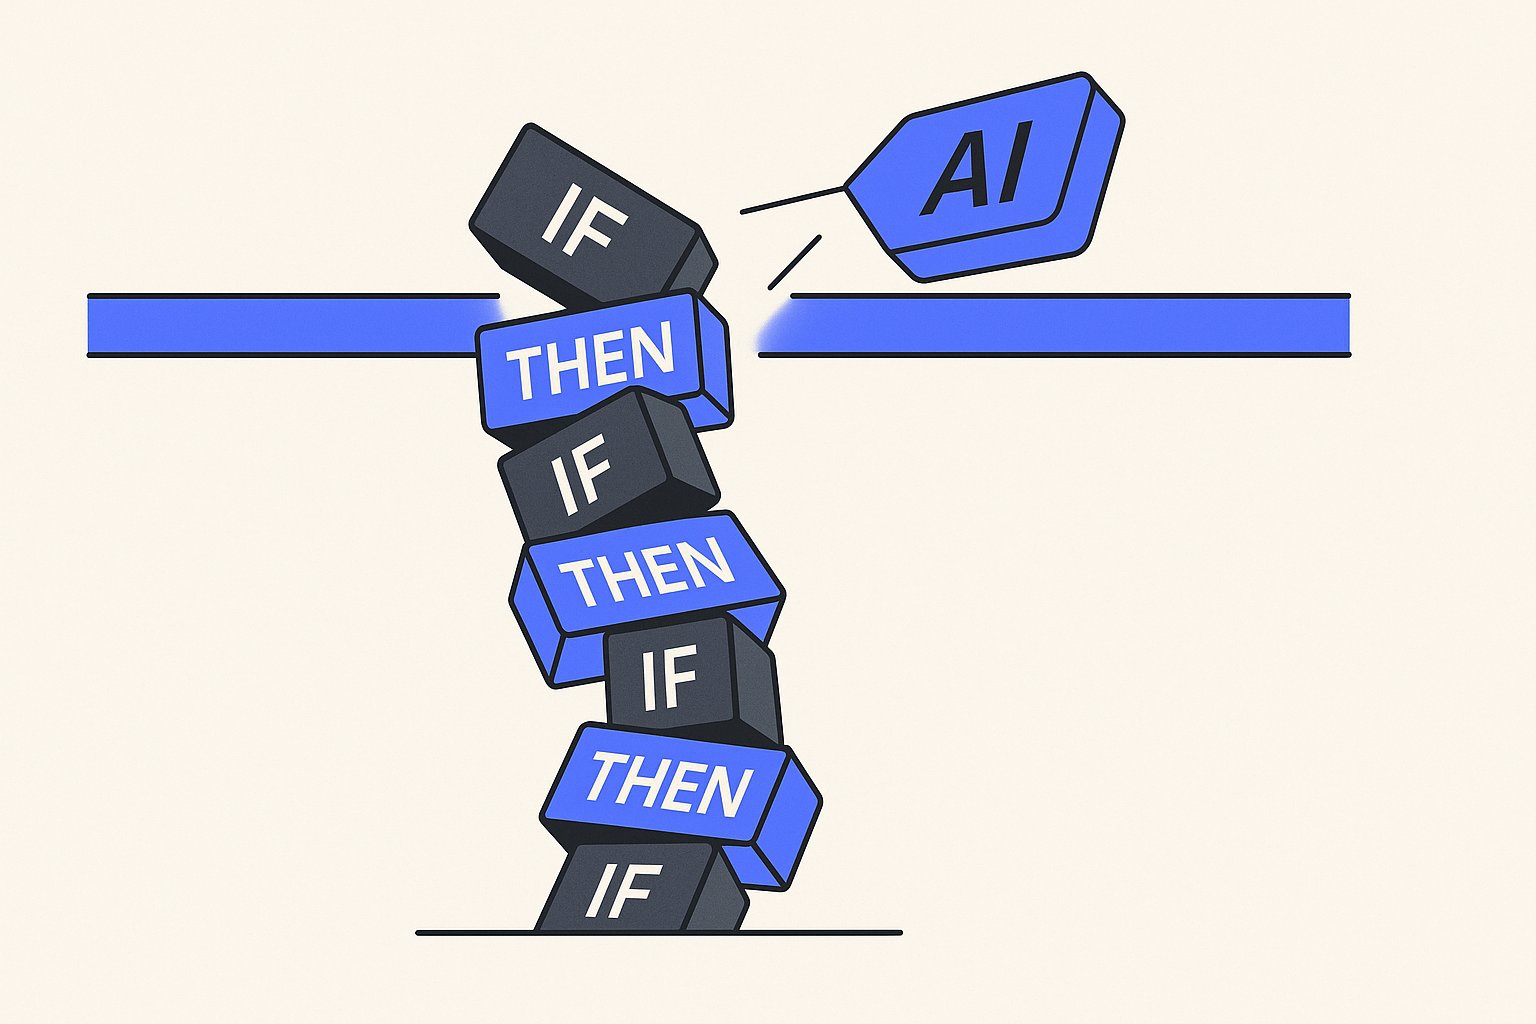
Most teams treat a product feed audit as an error-clearing exercise: log into Merchant Center, fix the red warnings, move. That approach catches maybe 20% of the revenue bleed.
The other 80% lives in data quality issues that Google doesn't flag as errors — it simply stops showing your products for high-intent queries, or throttles impression share on your best SKUs. Per Google's product data specification, the difference between an "approved" product and a well-optimised product is entirely in the quality tier, not compliance alone.
We rebuilt feeds for 14 DTC brands in Q1 2026 and the pattern was consistent: every single account had products approved in Merchant Center but bleeding impressions because of weak titles, missing attributes, and mismatched landing-page prices. Approved ≠ performing. For context on how feed quality ties directly to campaign efficiency, see our guide on Google Shopping feed optimization fundamentals.
Don't confuse "0 disapprovals" with a healthy feed. A feed with zero errors but thin titles and missing GTINs will consistently lose auction share to competitors with richer data — even at the same bid.
The 23-Point Checklist, Organised by Impact Tier
Run these in order. Tier 1 issues cause immediate disapprovals or heavy impression loss. Tier 2 issues drain CTR and conversion rate silently. Tier 3 issues are the marginal gains that separate 4× ROAS from 6×.
Beyond individual attribute fixes, how you segment SKUs into PMax asset groups determines whether those richer data signals are amplified or diluted — our Shopify PMax segmentation guide explains which product groups warrant a dedicated asset group at every spend tier.
Tier 1 — Compliance and Indexability (Data Points 1–8)
| # | Data Point | What to Check | Common Failure |
|---|---|---|---|
| 1 | GTIN / EAN / UPC | Present and valid for all branded products | Missing on 30–40% of products in new accounts |
| 2 | Price match | Feed price = landing page price to the cent | Off by pennies due to rounding; causes disapprovals |
| 3 | Availability accuracy | "in_stock" matches real inventory | Oversold products staying "in_stock" in feed |
| 4 | Product condition | Explicitly set (new / used / refurbished) | Omitted on 60%+ of apparel and electronics feeds |
| 5 | Brand attribute | Present for every product | Left blank on private-label SKUs |
| 6 | Image URL validity | Returns 200, image ≥ 800×800 px, no watermarks | Staging URLs in prod feed; images below 500 px |
WooCommerce stores face an additional layer of risk here: default plugin exports frequently ship staging URLs and mismatched prices simultaneously, a pattern we document across 9 WooCommerce feed misconfigurations that compound Tier 1 failures.
| | 7 | Landing page crawlability | URL returns 200 for Googlebot | Shopify password pages left on during feed tests | | 8 | Tax and shipping data | Merchant Center account-level or per-product | Missing causes "missing shipping info" disapprovals |
Fix every item in Tier 1 before touching anything else. In our experience, clearing these 8 points alone recovers an average of 12% of disapproved impressions within 72 hours of a feed re-fetch.
If any of these 8 points surface deeper Merchant Center flags, our Merchant Center error diagnostic guide maps the 12 most common disapproval triggers to a specific 30-minute fix each.
Tier 2 — Title and Description Quality (Data Points 9–16)
Title quality is the single highest-leverage variable in a shopping feed audit. Google's ranking algorithm for Shopping uses product title tokens to match queries — a weak title is functionally a keyword gap. Across 200k+ SKUs we've tested, moving the primary attribute into the first 5 title words consistently lifted impression share by 8–14%.
| # | Data Point | What to Check | Target Standard |
|---|---|---|---|
| 9 | Title length | 70–150 characters | Under 70 = missed keywords; over 150 = truncated |
| 10 | Title keyword order | Primary attribute in first 5 words | Brand → Product type → Key attribute → Variant |
| 11 | Variant specificity | Color, size, material in title | "Blue Cotton Men's Polo Shirt XL" beats "Polo Shirt" |
Variant specificity also determines whether Google treats your SKUs as unique listings or near-duplicates — splitting colour and size into separate entries can lift impression share by 30–45% in apparel, as detailed in our guide to Shopify variant feed structure.
| | 12 | Description length | 500–1000 characters | Under 300 = thin; over 5000 = padding | | 13 | Description keyword density | 3–5 natural mentions of core terms | Stuffed or empty; neither indexes well
If you're running the same feed across Meta Advantage+ Shopping, note that Meta's catalog ranking weights description keyword density and custom labels differently from Google — our Meta catalog attribute guide covers the exact delta.
| | 14 | Custom labels | At least 3 of 5 slots used for bidding logic | All blank = no Smart Bidding segmentation
Custom labels are also the primary mechanism for margin-aware bidding — if you're leaving all 5 slots blank, you're training Smart Bidding to optimise revenue rather than profit, a distinction our margin-aware feed segmentation guide quantifies across 50+ Shopify stores.
| | 15 | Product type taxonomy | Multi-level (3+ tiers) | Single-level kills negative keyword control in PMax
Single-level product type taxonomy is especially punishing inside PMax, where Google's ML relies on feed taxonomy depth to route products — our PMax attribute priority breakdown shows exactly which attributes carry the most weight in 2026.
| | 16 | google_product_category | Set at level 4+ specificity | Level 1 or 2 = Google assigns its own, often wrong |
For deeper guidance on title structure and the exact keyword patterns that outperform, see our breakdown of Google Shopping title optimization strategies — it covers 7 rewrite patterns we've tested across 200k+ SKUs.
Tier 3 — Conversion and Differentiation Signals (Data Points 17–23)
| # | Data Point | What to Check | Why It Matters |
|---|---|---|---|
| 17 | sale_price + sale_price_effective_date | Set correctly during promotions | Missing = no strikethrough price in ad unit; CTR drops ~22% |
| 18 | promotion_id | Linked to active Merchant Center promotions | Unmapped = promotional badge invisible on SERP |
| 19 | product_highlight (if eligible) | 3–5 bullet points per product | Shows in the Shopping Knowledge Panel; lifts click quality |
| 20 | additional_image_link | Minimum 3 alt images per SKU | Single image limits Google's visual matching |
| 21 | lifestyle vs. white-background images | At least 1 lifestyle image per hero SKU | Google's image quality score factors this for PMax |
| 22 | return_policy attribute | Set at account or product level (2021+ spec) | Missing penalises trust score in Shopping ranking |
| 23 | certification (where applicable) | Energy labels, eco-certs for EU/UK markets | Non-compliance blocks EU Shopping after 2024 mandate |
Data point 17 alone — the sale price strikethrough — is one of the most under-utilised levers we see. Across 4 client accounts running PMax in Q1 2026, adding correctly formatted sale_price fields during a promotional window lifted CTR by an average of 19% with zero bid change.
How to Prioritise Fixes When You Have 10,000+ SKUs
When your catalogue is large, you cannot fix everything in one sprint. Here's the triage logic we use with clients.
Step 1 — Segment by revenue potential. Pull your Google Ads product performance report and sort by revenue (last 90 days). Focus Tier 1 and Tier 2 fixes on your top-200 revenue SKUs first. These products have proven demand; feed errors here cost real money.
Step 2 — Batch by error type, not by product. It's faster to fix all missing GTINs across 500 products at once than to fully audit product #1 before moving to product #2. Export your Merchant Center diagnostics report, filter by issue type, and fix in bulk via supplemental feeds or your feed tool.
Step 3 — Use custom labels to track audit status. Set custom_label_4 to "audit_q2_2026" on every product you've reviewed. This lets you segment campaigns to prioritise audited products in bidding — and it gives you a clean before/after comparison in Search Term reports.
Step 4 — Re-fetch and measure at 7 days. After submitting fixes, request a manual re-fetch in Merchant Center. Give it 7 days, then compare impressions-per-product for the fixed cohort vs. the unfixed cohort. Median impression lift we see: 23%.
For large-scale title and description rewrites — the kind that make Tier 2 fixes feasible across thousands of products — AI-powered feed rewriting can compress weeks of manual work into hours. The key is maintaining attribute accuracy while improving keyword density, which is where manual rewrites tend to drift. Our post on bulk feed optimization for large catalogues covers the exact workflow we use for catalogues over 5,000 SKUs.
If you're on Shopify or WooCommerce, run your feed through Merchant Center's "Test product" tool before a full re-fetch. It surfaces price mismatches and crawl blocks in under 2 minutes — faster than waiting for the next scheduled fetch to surface errors.
Common Mistakes That Invalidate an Otherwise Good Audit
Even teams who run thorough audits routinely make these mistakes — and each one can silently undo hours of fix work.
Fixing feed attributes without checking landing-page parity. Per Google's landing page requirements, the title, price, and availability on the product page must match the feed. We've seen accounts where the feed was pristine but 8% of landing pages still showed the old price, triggering a wave of re-disapprovals within 48 hours of a re-fetch.
Auditing once and assuming it's stable. Product feeds are living documents. Every new product addition, price change, or sale event creates new audit surface area. The accounts we manage with the best long-term feed health run automated diagnostic checks every 48 hours, not quarterly audits.
Treating all SKUs as equal. A feed with 15,000 products where your top 100 revenue SKUs have perfect data is categorically better than one where you've applied mediocre improvements uniformly. Concentration of quality on high-revenue products outperforms average quality everywhere.
Ignoring feed-level signals for PMax. Performance Max uses your feed as a creative signal, not just a matching signal. Thin descriptions and missing lifestyle images don't just hurt Shopping — they degrade the asset quality score for PMax display and YouTube surfaces. We've documented a 31% improvement in PMax asset quality scores after fixing Tier 2 and Tier 3 feed points on a client's top-50 products.
Running This Audit in One Session
A structured run-through of all 23 data points takes 3–4 hours for a catalogue up to 5,000 SKUs when you have the right exports ready. Here's what to pull before you start:
- Merchant Center diagnostics export — Download the full "Products" tab filtered to "All issues". This covers data points 1–8 directly.
- Google Ads product performance report — 90-day window, segmented by product, showing impressions, CTR, conversions, revenue. This is your prioritisation layer.
- Feed raw export (CSV or XML) — Pull directly from your feed source. You need this to check Tier 2 and Tier 3 attributes that Merchant Center doesn't surface in its UI.
- Landing page spot-check — For your top 50 SKUs, manually verify price, availability, and title parity between the feed export and the live URL.
With those four documents open, you can work through the checklist systematically. Items 1–8 come from your diagnostics export. Items 9–16 require the raw feed and some string-length counting — most spreadsheet tools handle this with a =LEN() formula. Items 17–23 are best checked in the raw feed combined with a quick visual review of a representative sample of product pages.
The Shopify help documentation on Google channel feeds is a useful reference if you're troubleshooting crawlability or price-sync issues specific to the Shopify–Merchant Center integration.
The goal isn't perfection on day one. It's knowing exactly which 23 variables your feed is being scored, and having a prioritised fix list that your team (or your feed tool) can execute against systematically.
See exactly which of the 23 audit points are failing for your catalogue, ranked by estimated revenue impact. No dev work required — connect your Merchant Center in under 2 minutes.
Related articles

AI Search Is Reshaping Google Shopping: Feed for SGE in 2026
Google AI shopping feed optimization now hinges on 6 feed attributes that decide which products appear in AI Overviews carousels. Fix your feed in one pass.
Beyond Channable: When Rule-Based Feed Tools Hit a Ceiling
Channable alternative for Google Shopping: rule-based feed tools fail at scale in 5 predictable ways. See the real cost and what AI rewriting fixes in under a day.

Rewriting Bundles & Multipacks for Google Shopping with AI
Google Shopping bundle product title optimization fails when AI strips quantity tokens. Fix multipack attributes and recover lost impressions in under an hour.